Disclaimer: The content provided in this article is intended for general informational purposes only and should not be construed as financial advice. The analysis presented is based on cyclical patterns in historical data, which may not be applicable to specific financial situations or investment decisions. Readers are advised to conduct their own research and consult with qualified financial professionals before making any investment or business choices. The author and Cycle Quest shall not be held responsible for any losses, damages, or liabilities resulting from the use of the information presented in this article. Additionally, past performance or historical trends are not indicative of future results. Individual circumstances and market conditions may vary, so exercise caution and judgment when applying the insights discussed in this article.
Are you looking for a reliable way to get ahead of market trends and understand economic cycles? Look no further than Cycle Quest. Cycle Quest is a powerful tool designed to help investors analyze and predict cyclical patterns in GDP. Today, let us show you how we predict US GDP cycle with our team.
By understanding the cyclical component of GDP, analysts can accurately forecast GDP changes and gain valuable insights into long-term market trends. Unlock the power of Cycle Quest and start making informed economic decisions today!
Cycle analysis provides an invaluable tool for predicting US GDP changes. By breaking down GDP into its cyclical components, we can identify underlying trends and make more informed decisions about the economic future.
By transforming quarterly GDP data into monthly data, we gain a more granular insight into economic trends. This higher frequency data allows for more accurate cycle analysis and forecasting.
Don’t miss out on the key insights cycle analysis can offer. Contact us today to begin your journey with Cycle Quest. Stay ahead of the curve and join the growing number of investors leveraging cycle analysis to unlock valuable insights into economic trends.
Table of Contents
Transforming Quarterly Data into Monthly Insights
At Cycle Quest, we understand the power of data granularity. That’s why we’ve chosen to analyze GDP changes by transforming quarterly data into monthly insights. But how exactly do we achieve this?
Our secret lies in a statistical technique known as linear interpolation. Linear interpolation allows us to construct new data points within the range of a discrete set of known data points – in this case, the quarterly GDP data. By applying this method, we can estimate the GDP for the months within each quarter, effectively increasing the frequency of our data from quarterly to monthly.
Why do we do this? Simple – it provides a more detailed roadmap of the economy’s journey. Instead of only four stops a year, we now have twelve – a threefold increase in chances to spot trends, respond to changes, and forecast future cycles. This means that you, the investor, can make decisions more confidently and accurately. With Cycle Quest, you’re not just staying ahead of the curve: you’re defining it.
Uncovering the Cyclical Component of GDP
U.S. Bureau of Economic Analysis, Real Gross Domestic Product [A191RL1Q225SBEA], retrieved from FRED, Federal Reserve Bank of St. Louis; https://fred.stlouisfed.org/series/A191RL1Q225SBEA, August 7, 2023.
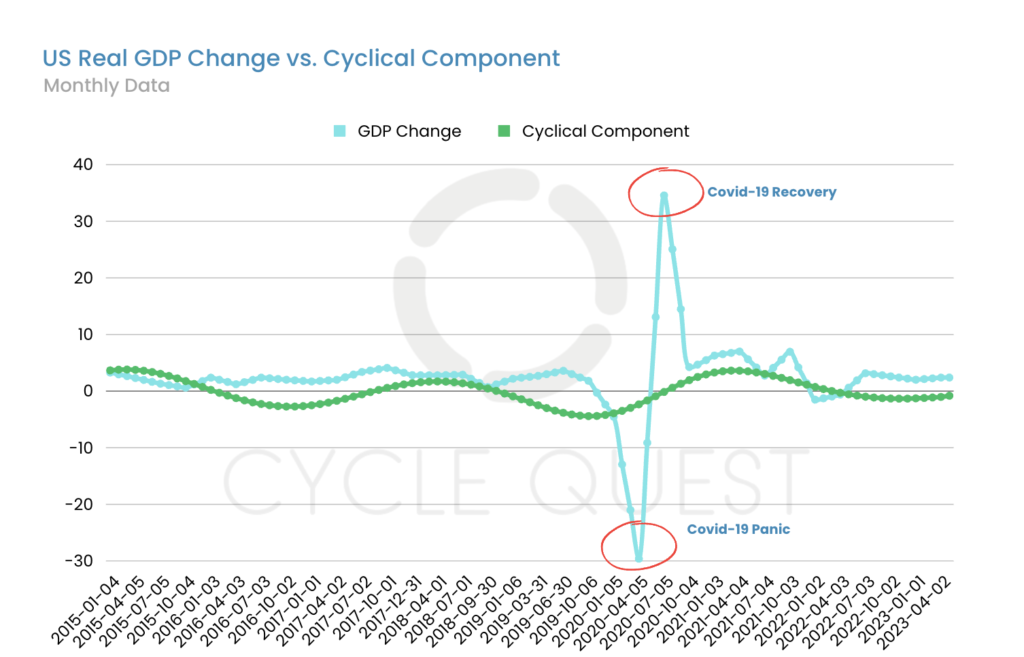
The Covid-19 pandemic has posed unprecedented challenges to analyzing the cyclical movements of GDP. With the virus causing sharp, erratic economic fluctuations, traditional cycle analysis methods can struggle to discern underlying trends.
Chart 1 illustrates this challenge in stark detail – the economic turbulence caused by Covid-19 has muddied the waters of cyclical analysis, making it more difficult to spot the patterns and trends crucial for accurate GDP forecasting.
However, with Cycle Quest, these challenges are not insurmountable. Our sophisticated techniques and innovative approach to cycle analysis allow us to disentangle the cyclical components of GDP from the noise of the pandemic.
This allows us and our investors to continue making informed decisions based on reliable insights, even in these uncertain times. Join us on this exciting cycle adventure and redefine your investment journey with Cycle Quest!
Removing High GDP Variations for Clearer Cyclical Analysis
U.S. Bureau of Economic Analysis, Real Gross Domestic Product [A191RL1Q225SBEA], retrieved from FRED, Federal Reserve Bank of St. Louis; https://fred.stlouisfed.org/series/A191RL1Q225SBEA, August 7, 2023.
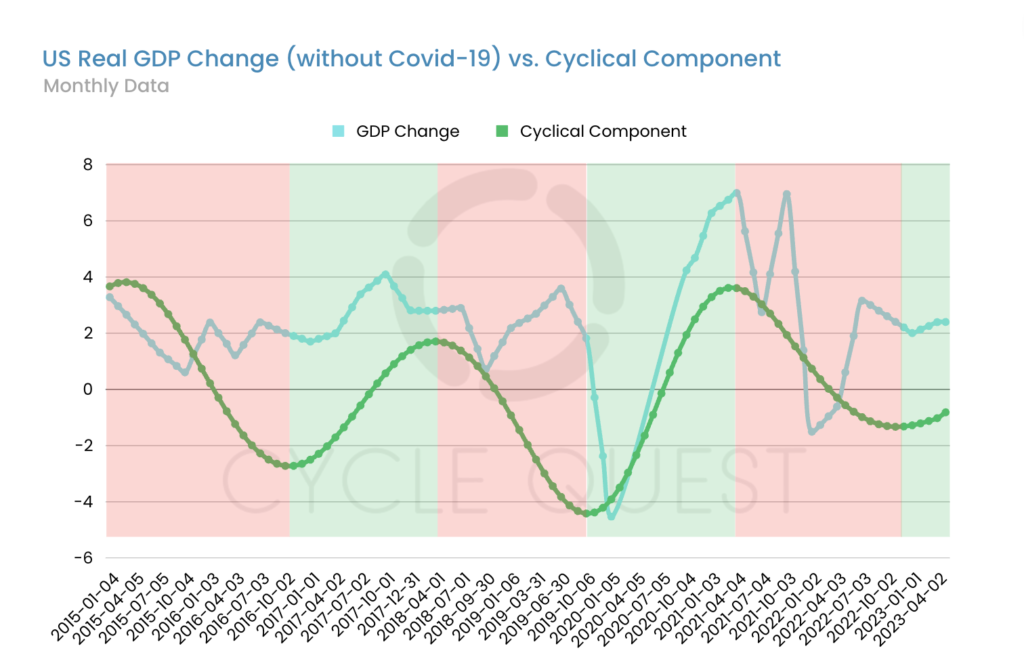
Bearing the brunt of the Covid-19 pandemic, the period between February 2020 and September 2020 witnessed severe fluctuations in GDP. While indicative of the global economic turmoil, these variations can muddy the waters of our cyclical analysis.
By eliminating these extreme fluctuations, we can regain a clearer perspective on the underlying cyclical movement of GDP. This process allows us to filter out the noise and focus our analysis on identifying consistent, long-term trends – the bread and butter of our cyclical forecasting.
Chart 2 provides a visual representation of this process. With the high variations removed, we can clearly see periods of cyclical growth and decline, unobscured by the economic distortion caused by the pandemic. Thus, despite the challenges, Cycle Quest delivers precise and reliable insights, ensuring your investment decisions are grounded in solid, dependable data.
The chart is easy to read: green areas mark periods of growth, while red areas indicate periods of decline. As you see, it’s really hard to ignore the cyclical movements of an economy when you look at it this way.
Join us as we continue our cycle adventure, confidently and precisely navigating the economic cycles. With Cycle Quest, you’re not just keeping pace with the economy – you’re charting its course.
The Power of Cycle Analysis in Prediction
U.S. Bureau of Economic Analysis, Real Gross Domestic Product [A191RL1Q225SBEA], retrieved from FRED, Federal Reserve Bank of St. Louis; https://fred.stlouisfed.org/series/A191RL1Q225SBEA, August 7, 2023.
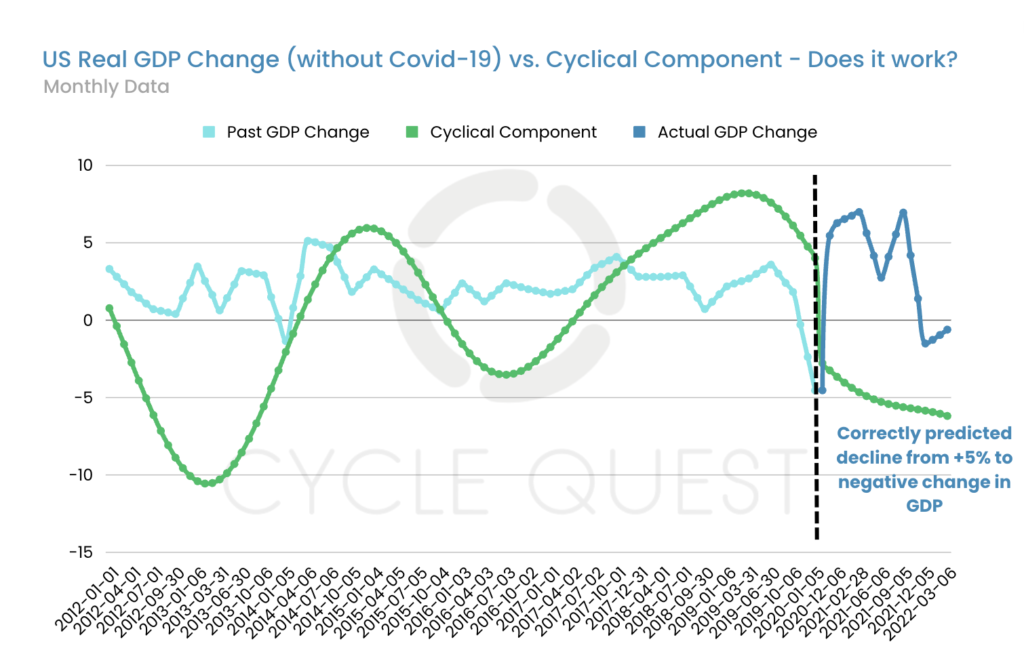
Cyclical analysis plays a pivotal role in predicting GDP variations. Although it cannot pinpoint the exact GDP variation, it clearly indicates the underlying trends. Let’s dive into the depths of Chart 3 as an example.
If we journey back to May 2020 (highlighted by the dotted vertical line in the chart) and apply our cycle analysis, we would have forecasted a decline in GDP. The official data confirmed our prediction by shifting from +5% to -1%. This crystal-clear example underscores the predictive power of cycle analysis.
While we might not be able to anticipate the precise GDP variation, we can certainly foresee the general momentum of economic trends. So jump aboard and join us as we navigate the volatile waters of the global economy with confidence and precision.
Gazing into the Economic Crystal Ball
U.S. Bureau of Economic Analysis, Real Gross Domestic Product [A191RL1Q225SBEA], retrieved from FRED, Federal Reserve Bank of St. Louis; https://fred.stlouisfed.org/series/A191RL1Q225SBEA, August 7, 2023.
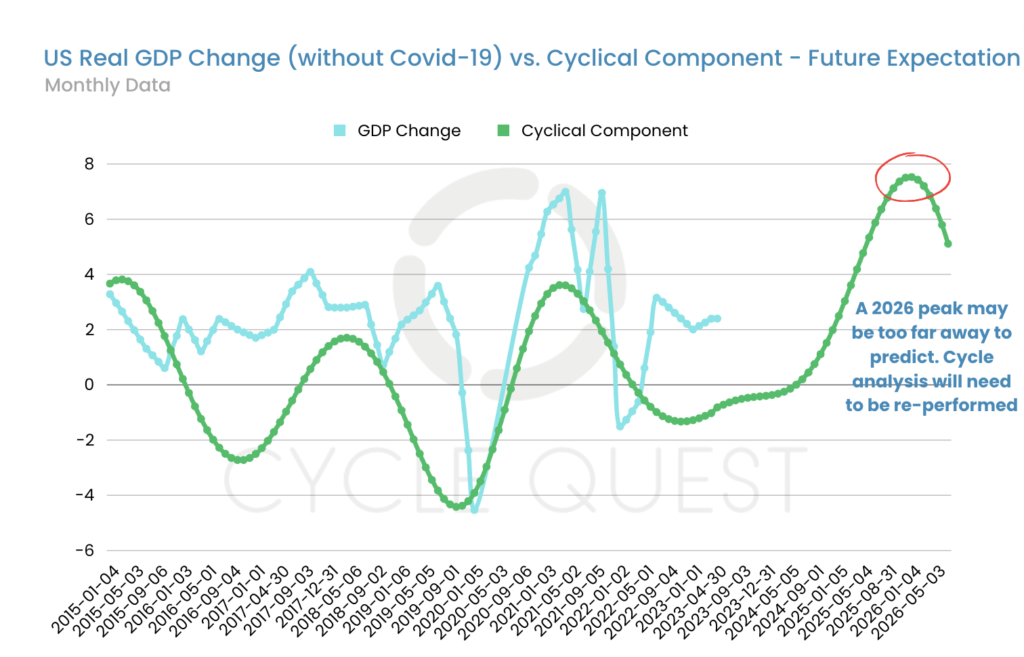
As we set sail into the uncharted waters of the future, let’s gaze toward Chart 4. This chart displays our prediction of GDP change for the future, with cycle analysis indicating a peak in early 2026.
While it may seem like we’re gazing too far into the future, it’s important to remember that cyclical analysis is a dynamic process. The cycles shift and change with the economy’s ebb and flow, requiring us to perform and re-perform our analysis over time.
At this juncture, it’s clear that the US GDP is currently in a cyclical growth phase. Of course, predicting a peak so far ahead might be akin to spotting a lighthouse in a storm. But with our sophisticated tools and techniques, we’re not just guessing – we’re making informed, data-driven forecasts.
So come and join us on this thrilling cycle adventure; together, we’ll navigate the ever-changing currents of the economic sea. With Cycle Quest, you’re always sailing toward success.
Cycle Quest – Your Partner in Cyclical Analysis
Cycle Quest provides custom cyclical analysis services designed to meet the unique needs of businesses, investors, and anyone eager to learn. Our team of seasoned consultants have expertise across different sectors, guaranteeing proficiency in gathering and evaluating the most effective datasets.
Here is the straightforward three-step procedure you should be aware of before reaching out to Cycle Quest:

Reach out to us to delve into the multitude of instances where the power of cyclical analysis has been harnessed effectively in various domains such as business, investments, sports, and scientific research. Let Cycle Quest serve as your compass, helping you uncover the concealed cyclical rhythms within your data, and empowering you to heighten your competitive advantage and refine your strategic planning.

